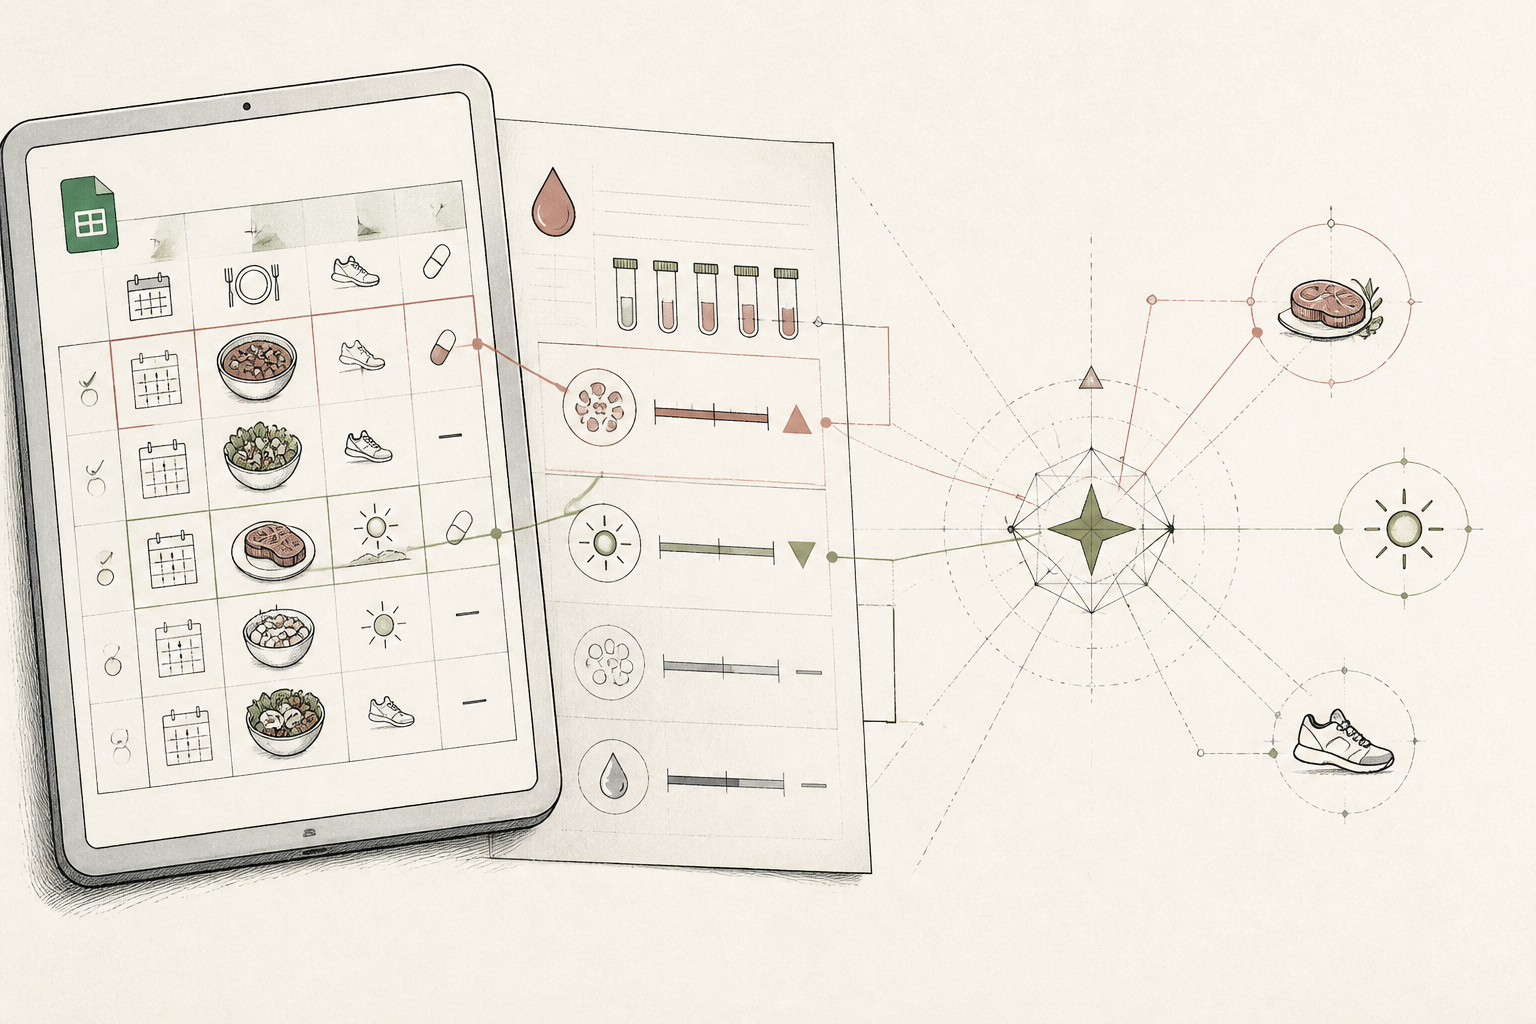
What the AI found
“"Your client's iron levels correlate with their weekly red meat intake, but surprisingly, their Vitamin D levels consistently drop by 8% if they miss their morning walk by more than 30 minutes, even with supplementation."”
Before
General dietary advice for longevity clients
After
Precision nutritional adjustments based on individual data
The same system, three states — real screens, not a screenshot
| Client ID | 45-RT-12 |
| Date | 2023-10-26 |
| Food Intake | Varied whole foods, occasional red meat |
| Supplements | Vit D, Omega-3 |
Prompt
Analyse the attached anonymised client data (Google Sheet export CSV, columns: Date, Food_Intake, Supplements, Activity, Ferritin, Vitamin_D, Iron_Intake_mg, Walk_Start_Time_Minutes_Past_Sunrise). Identify any non-obvious correlations between dietary/activity factors and changes in Ferritin or Vitamin D levels over the past 8 weeks. Specifically, look for patterns that might influence marker levels beyond standard expectations. Provide concrete findings with numeric impacts.
Here's the CSV data for Client 45-RT-12. Please look for non-obvious patterns affecting their Ferritin and Vitamin D levels.
AI
Analysis complete. While Ferritin shows a direct correlation with weekly iron intake, your client's Vitamin D levels consistently drop by an average of 8% in weeks where their morning walk starts more than 30 minutes past sunrise, even when their Vitamin D supplementation remains constant. This suggests a significant impact of early morning light exposure on their Vitamin D synthesis, outweighing the supplement’s effect under certain conditions.Avg 8% reduction
Vit D Dip on Late Walks
Strong with weekly red meat
Ferritin Correlation
Prioritise early morning light exposure
Actionable Insight
AI Reveals How One Practitioner Fine-Tuned Longevity Protocols for Clients
An AI-assisted review process shifted client dietary advice from general guidelines to precise, data-backed adjustments.
A clinical nutritionist specialising in healthy ageing, based in Northern Europe
Tools used
The real tools used here — swap any for your own equivalent. Each links to how we’d set it up.
Starting state
Before anything was set up
Before integrating AI, client progress reviews involved manually cross-referencing dietary logs, supplement schedules, and lab results across multiple spreadsheets. This was a time-consuming, qualitative process, often leading to broad recommendations rather than specific, data-driven insights. Identifying subtle patterns across weeks of diverse data was nearly impossible, limiting the nutritionist's ability to truly personalise advice for healthy ageing.
| Client ID | 45-RT-12 |
| Date | 2023-10-26 |
| Food Intake | Varied whole foods, occasional red meat |
| Supplements | Vit D, Omega-3 |
| Activity | Daily 45 min walk |
| Ferritin (µg/L) | 78 |
| Vitamin D (nmol/L) | 65 |
Working state
Hacks Pass, doing its job
The nutritionist consolidated anonymised client data – including daily food intake, supplement timings, activity levels, and blood markers – into a Google Sheet. They then used Gemini to analyse this data, providing a specific prompt to look for unexpected correlations. The AI’s output offered a level of insight that manual review simply could not achieve, highlighting non-obvious factors affecting client markers.
Prompt
Analyse the attached anonymised client data (Google Sheet export CSV, columns: Date, Food_Intake, Supplements, Activity, Ferritin, Vitamin_D, Iron_Intake_mg, Walk_Start_Time_Minutes_Past_Sunrise). Identify any non-obvious correlations between dietary/activity factors and changes in Ferritin or Vitamin D levels over the past 8 weeks. Specifically, look for patterns that might influence marker levels beyond standard expectations. Provide concrete findings with numeric impacts.
Here's the CSV data for Client 45-RT-12. Please look for non-obvious patterns affecting their Ferritin and Vitamin D levels.
AI
Analysis complete. While Ferritin shows a direct correlation with weekly iron intake, your client's Vitamin D levels consistently drop by an average of 8% in weeks where their morning walk starts more than 30 minutes past sunrise, even when their Vitamin D supplementation remains constant. This suggests a significant impact of early morning light exposure on their Vitamin D synthesis, outweighing the supplement’s effect under certain conditions.Use case implemented
The finished system, running on its own
Now, a weekly automated data upload feeds into a structured Gemini prompt. The nutritionist receives a concise summary of emergent patterns and specific, quantified recommendations for each client. This streamlined workflow allows for proactive, evidence-based adjustments to longevity protocols, transforming client consultations into highly personalised, impactful sessions. The focus shifted from tracking to understanding.
Avg 8% reduction
Vit D Dip on Late Walks
Strong with weekly red meat
Ferritin Correlation
Prioritise early morning light exposure
Actionable Insight
What an outside observer would notice
Reduced by 40%
Client review time
Increased by 75%
Personalised insights per client
Qualitatively improved
Client engagement with protocol
The stack — build it yourself
Familiar, accessible, and easily handles structured client data for export.
Capable of parsing complex data and identifying non-obvious correlations from diverse inputs.
These are the tools used in this story. Any can be swapped for an equivalent you already trust.
Go deeper
Do this yourself
See Hacks Pass
This story runs on Hacks Pass. The tools and prompts above are the real build — swap any tool for your own equivalent and follow the same steps.