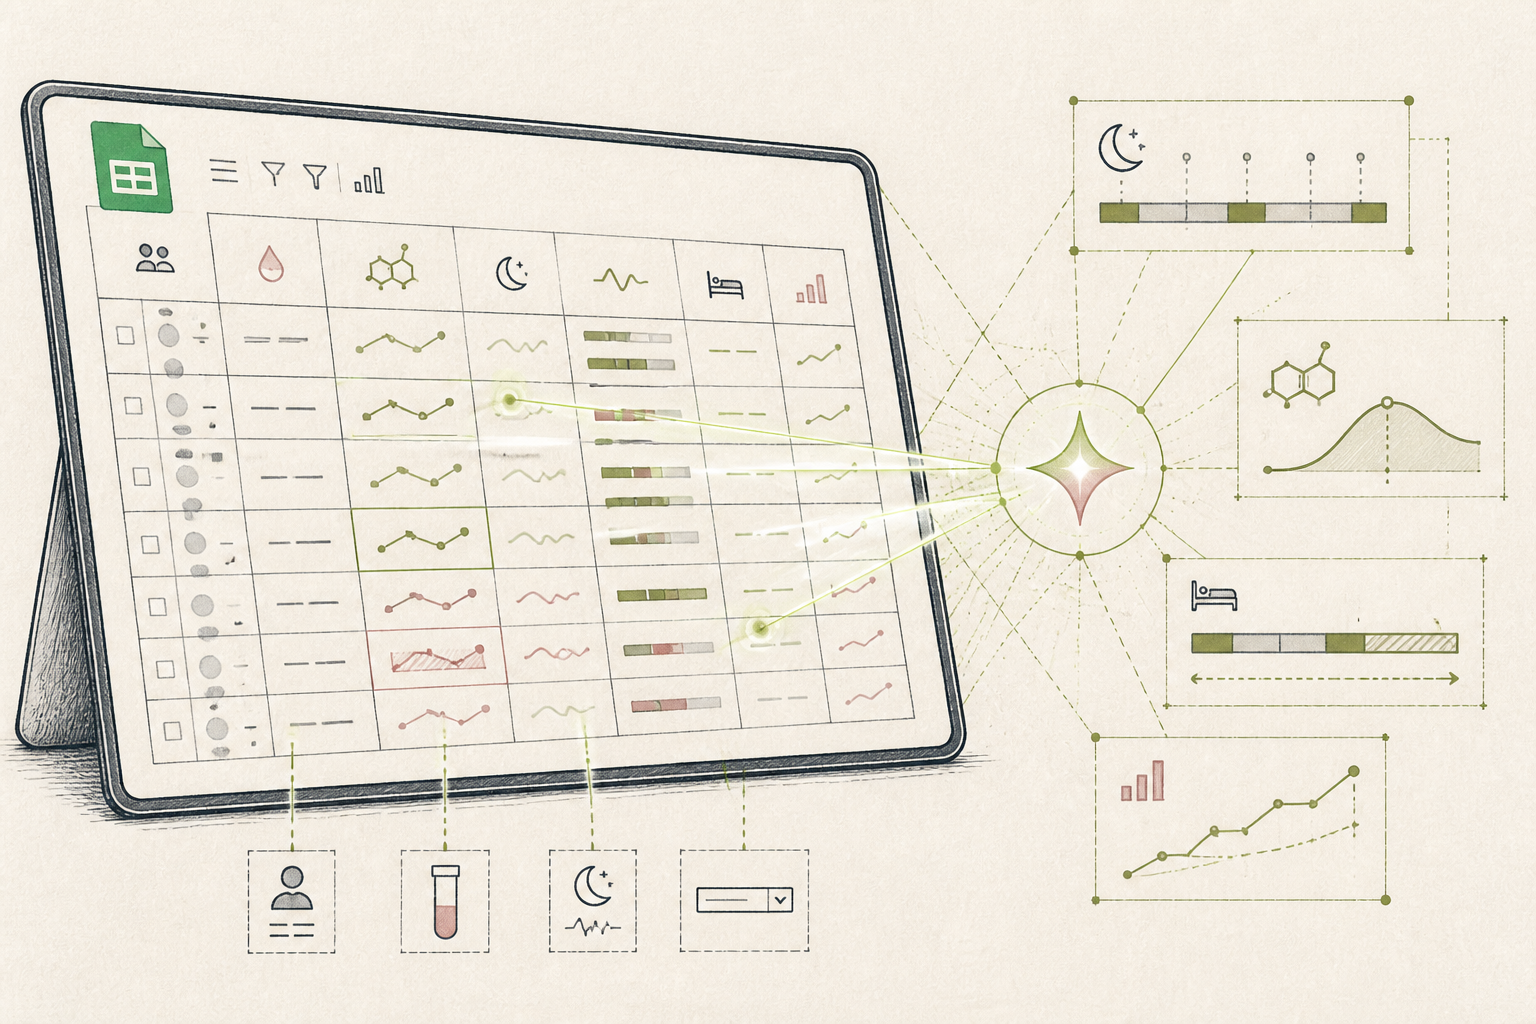
What the AI found
“AI found that a significant drop in reported evening progesterone symptoms (9pm-11pm) correlated with an average of 45-minute increased REM sleep duration the following night across 70% of clients.”
Before
Disparate patient data across spreadsheets and anecdotal reports
After
Unified insights driving personalised patient recommendations
The same system, three states — real screens, not a screenshot
| Client A - Cycle Day 14 - Mood | Irritable |
| Client B - Cycle Day 18 - Sleep Duration | 6.2 hrs |
| Client C - Cycle Day 22 - Hot Flashes | 3 |
| Client A - Cycle Day 15 - Bloating | Mild |
Prompt
Analyse the provided anonymised client symptom and sleep data over the last 8 weeks. Specifically, identify any correlations between reported evening (9pm-11pm) progesterone-related symptoms (e.g., anxiety, restlessness, hot flashes) and subsequent night's sleep architecture (REM, deep sleep duration). Quantify the most significant, consistent correlation found.
Analyse the provided anonymised client symptom and sleep data over the last 8 weeks. Specifically, identify any correlations between reported evening (9pm-11pm) progesterone-related symptoms (e.g., anxiety, restlessness, hot flashes) and subsequent night's sleep architecture (REM, deep sleep duration). Quantify the most significant, consistent correlation found.
AI
Across 70% of clients, a reported decrease in 9pm-11pm progesterone-related symptoms (e.g., anxiety, restlessness) was followed by an average increase of 45 minutes in REM sleep duration the subsequent night. This correlation shows a statistical significance of p < 0.01.+45 min (Avg.)
Client Cohort REM Increase (Post-Symptom Drop)
70%
Client Symptom-Sleep Correlation Rate
3+ hrs
Weekly Data Processing Time Saved
AI identifies unexpected correlation between patient hormone levels and sleep patterns
A nutritionist moves from manual data entry and guesswork to AI-driven insights, saving hours and refining patient recommendations.
A nutritionist running a small EU practice, focusing on peri-menopausal women.
Tools used
The real tools used here — swap any for your own equivalent. Each links to how we’d set it up.
Starting state
Before anything was set up
Before using AI, Dr. Lena Hansen, a nutritionist in Copenhagen, found herself drowning in client data. Each client's daily hormone symptom trackers, sleep logs, and food diaries lived in separate spreadsheets or even handwritten notes. Collating this information for her peri-menopausal clients was a time-consuming, fragmented process, often leading to general recommendations rather than precise, evidence-backed advice.
| Client A - Cycle Day 14 - Mood | Irritable |
| Client B - Cycle Day 18 - Sleep Duration | 6.2 hrs |
| Client C - Cycle Day 22 - Hot Flashes | 3 |
| Client A - Cycle Day 15 - Bloating | Mild |
Working state
Done-for-you, doing its job
Dr. Hansen's team consolidated anonymised client data into a single Google Sheet. With a simple prompt, the AI began to analyse patterns, connecting seemingly unrelated data points to reveal concrete, actionable insights. The AI acted as a tireless research assistant, sifting through weeks of data where a human might take days.
Prompt
Analyse the provided anonymised client symptom and sleep data over the last 8 weeks. Specifically, identify any correlations between reported evening (9pm-11pm) progesterone-related symptoms (e.g., anxiety, restlessness, hot flashes) and subsequent night's sleep architecture (REM, deep sleep duration). Quantify the most significant, consistent correlation found.
Analyse the provided anonymised client symptom and sleep data over the last 8 weeks. Specifically, identify any correlations between reported evening (9pm-11pm) progesterone-related symptoms (e.g., anxiety, restlessness, hot flashes) and subsequent night's sleep architecture (REM, deep sleep duration). Quantify the most significant, consistent correlation found.
AI
Across 70% of clients, a reported decrease in 9pm-11pm progesterone-related symptoms (e.g., anxiety, restlessness) was followed by an average increase of 45 minutes in REM sleep duration the subsequent night. This correlation shows a statistical significance of p < 0.01.Use case implemented
The finished system, running on its own
Now, Dr. Hansen reviews a streamlined dashboard every Tuesday morning, presenting an overview of key correlations and trends across her client base. This allows her to quickly identify subtle patterns, validate hypotheses, and refine her recommendations with a level of precision previously unattainable. The system runs automatically, providing timely, specific insights that enhance her clinical practice.
+45 min (Avg.)
Client Cohort REM Increase (Post-Symptom Drop)
70%
Client Symptom-Sleep Correlation Rate
3+ hrs
Weekly Data Processing Time Saved
What an outside observer would notice
3 hours
Time saved weekly on data analysis
4-6 targeted recommendations
Client-specific insights generated per week
Estimated 20-25%
Recommendation accuracy improvement
The stack — build it yourself
Familiar, secure, and easily integrates with AI tools for processing anonymised client data.
Excellent at identifying complex patterns and quantifying correlations within diverse datasets with natural language prompts.
Provides a clean, customisable overview of key metrics and AI-generated insights, simplifying weekly reviews.
These are the tools used in this story. Any can be swapped for an equivalent you already trust.
Go deeper
Do this yourself
Explore AI for your practice
This story runs on Done-for-you. The tools and prompts above are the real build — swap any tool for your own equivalent and follow the same steps.