Automation · Setup in 10 min· Setup Pass
Set up n8n to chart symptom data in 10 minutes
Build a private, automated workflow to turn a daily symptom journal into a data visualization you can actually read.
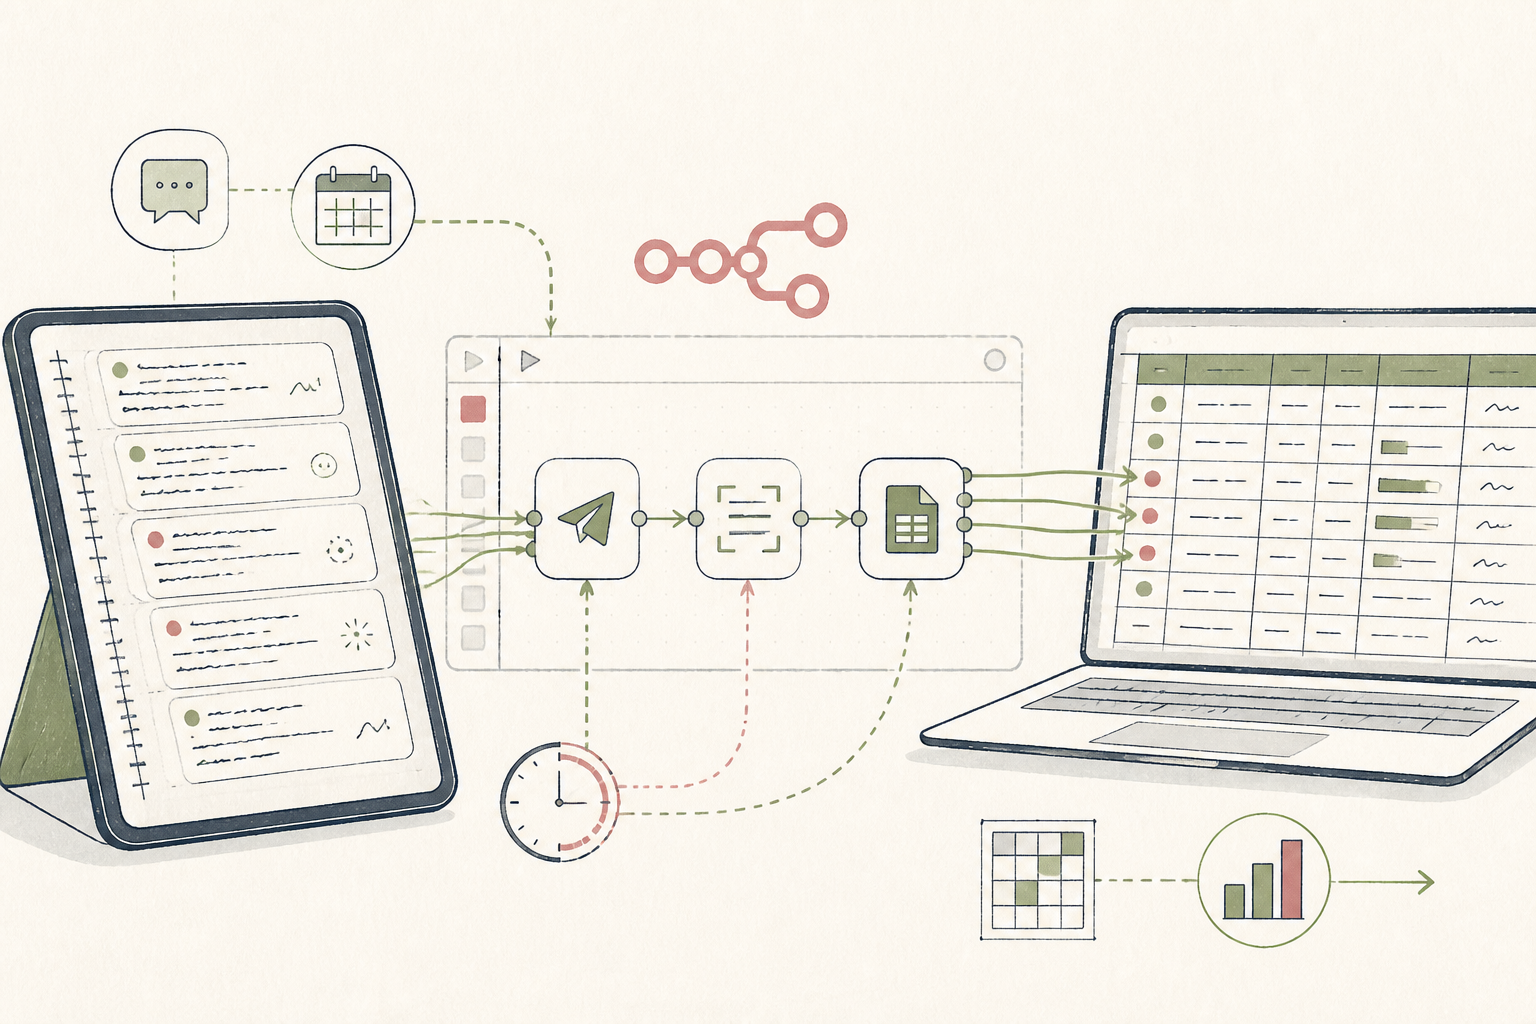
Symptom journals are notoriously hard to keep and even harder to learn from. This guide builds a simple, self-hosted workflow using n8n that automatically takes your daily notes from a private Telegram chat and adds them to a clean Google Sheet, ready for charting and analysis.
Before you start
- An n8n account (cloud or self-hosted)
- A new Telegram bot (via BotFather)
- A new Google Sheet
The steps
- 01
Create your Telegram trigger.
In a new n8n workflow, add a Telegram Trigger node. Authenticate your new bot using the token BotFather provided. Configure the trigger to fire on every message sent to your private chat with the bot.
- 02
Add a Set node for variables.
Add a 'Set' node after the trigger. Create two new string values: 'timestamp' and 'symptom'. Set 'timestamp' to the expression `{{ $json.message.date }}` and 'symptom' to `{{ $json.message.text }}` to extract the key data from Telegram's payload.
- 03
Format the timestamp.
Add a 'Date & Time' node. Use the expression `{{ $json.timestamp }}` as the 'From Value', set the 'From Format' to 'X' (for Unix timestamp), and 'To Format' to `YYYY-MM-DD HH:mm:ss`. This converts the raw Telegram date into a human-readable format for your sheet.
- 04
Connect to Google Sheets.
Add the 'Google Sheets' node and authenticate your Google account. Select 'Append or Update' as the operation. Point the node to your prepared Google Sheet and specify the sheet name.
- 05
Map data to your sheet.
In the Google Sheets node, map your columns. Set the 'Timestamp' column to the output of your 'Date & Time' node: `{{ $json.formattedDate }}`. Set the 'Symptom' column to the variable from your Set node: `{{ $json.symptom }}`. This tells n8n exactly where to place your journal entries.
- 06
Activate and test.
Activate the workflow. Send a message to your Telegram bot, like 'Headache, 4/10 intensity'. Watch it appear in your Google Sheet within moments. You now have a simple, automated Ledger for tracking any data you choose, ready to be charted.
Honest note
n8n is powerful but requires technical confidence. You are responsible for hosting, security, and maintenance, and workflows can fail silently if an external service changes its API. It is a tool for data routing, not analysis; it will not interpret the data for you.
Want the whole stack, not just one tool?
The free 10-Day Challenge wires these together. Or join the free 45-min live workshop and watch me build it end-to-end.