Automation · Setup in 10 min· Setup Pass
Set up Make.com to chart symptoms in 10 minutes
This guide configures Make.com to automatically log symptom data from a text message to a Google Sheet.
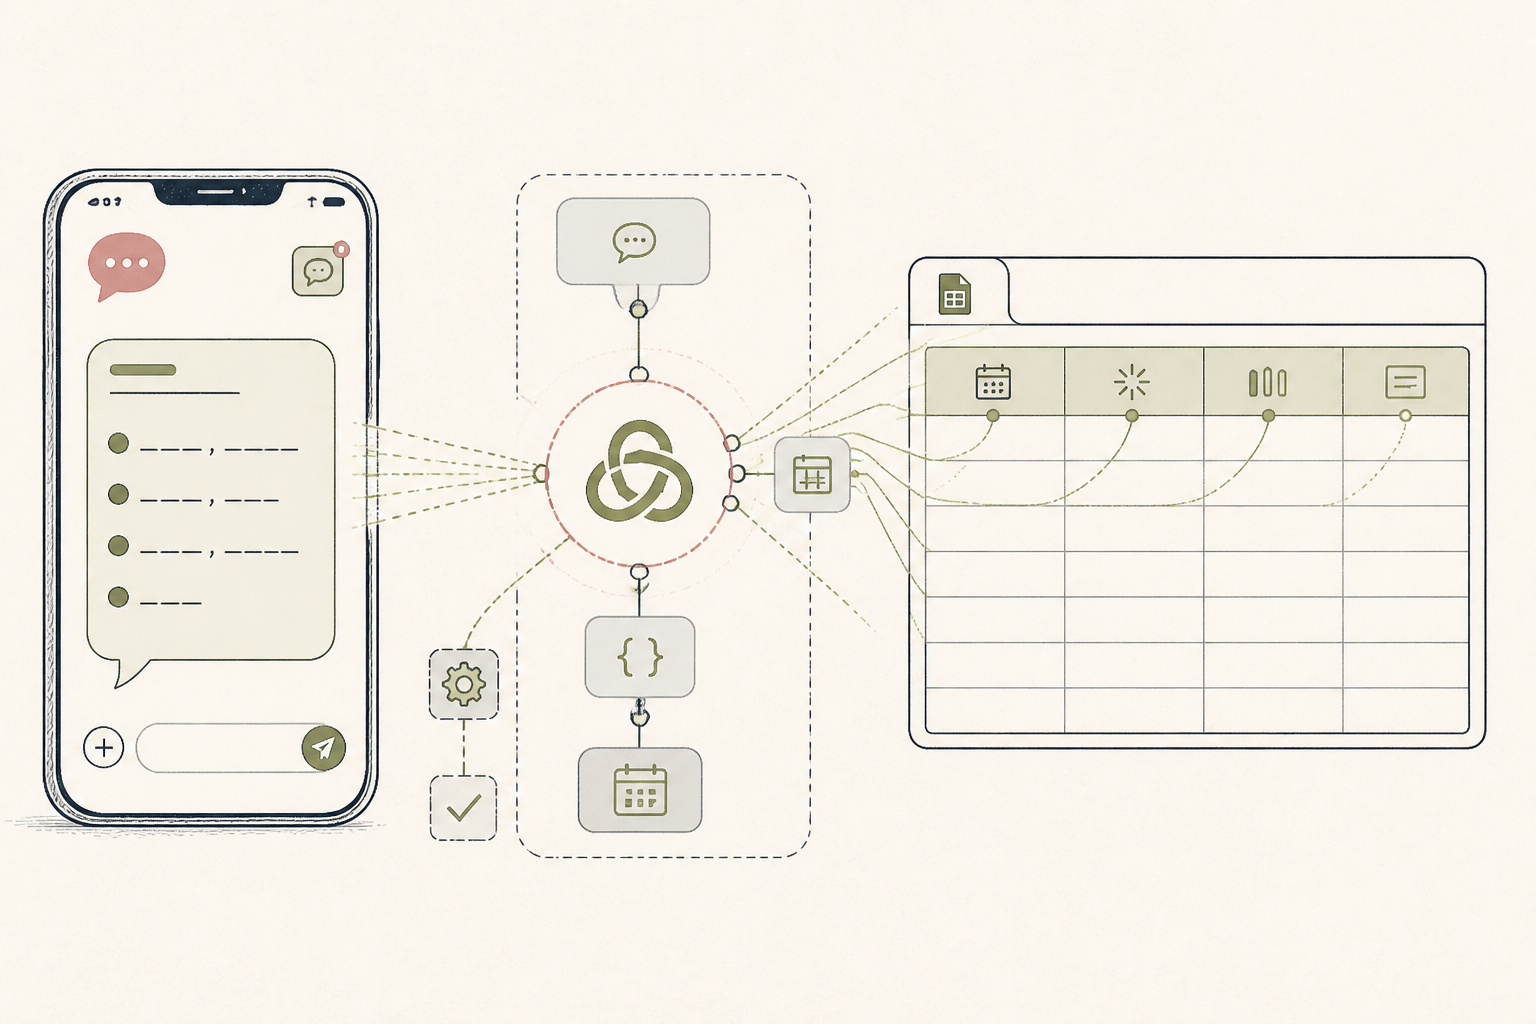
Symptom journaling is most effective when it is consistent. This setup removes the friction of opening an app or a notebook by creating a simple "text-to-log" workflow. You send a formatted text, and Make.com parses it into a structured Google Sheet for later analysis.
Before you start
- A Make.com account (free tier is sufficient)
- A Google account (for Google Sheets)
- A smartphone that can send SMS messages
The steps
- 01
Create a new scenario
From your Make.com dashboard, click "Create a new scenario". Scenarios are Make's term for automated workflows. Give it a descriptive name like "Symptom Logger".
- 02
Set up the webhook trigger
Your first module will be the trigger. Search for and select the "Webhooks" module, then choose the "Custom webhook" trigger. Click "Add", name your webhook (e.g., "SymptomInput"), and save. Copy the generated webhook URL to your clipboard; you will need it in the next step.
- 03
Configure your SMS client
To send data to the webhook, you need an app that can send an SMS or text with a POST request. I use an app called "HTTP Shortcuts" on Android for this. Create a new shortcut, paste the webhook URL, and set the method to POST. In the request body, structure your symptom entry. A simple format is `{"symptom": "Headache", "severity": "3", "notes": "Woke up with it."}`. This structured data is easier for Make to parse.
- 04
Add a Google Sheets module
Click the plus icon to add another module to your scenario. Search for "Google Sheets" and select the "Add a Row" action. Connect your Google account, then select the Google Sheet you prepared for your symptom log. This sheet should have columns like "Timestamp", "Symptom", "Severity", and "Notes".
- 05
Map the data fields
Now, map the incoming data from the webhook to the columns in your Google Sheet. In the Google Sheets module settings, click into the "Symptom" field and select the corresponding data point from the webhook (e.g., `1.symptom`). Repeat for severity and notes. For the timestamp, you can use the `now` variable from the webhook data to log when the entry was received. This creates a simple health "Ledger" in the 3-Layer Method, capturing raw data for future review.
- 06
Test and activate the scenario
Run the scenario once to ensure it's working correctly. Send a test symptom log from your phone. If the data appears in your Google Sheet, you can set the scenario to run "Immediately as data arrives". Now your automated symptom logger is active.
Honest note
Make.com is a powerful automation tool, but it is not a secure medical database. The data is transmitted through multiple services, so do not send highly sensitive personal health information. This setup is for personal tracking of non-critical data, not for clinical data management.
Want the whole stack, not just one tool?
The free 10-Day Challenge wires these together. Or join the free 45-min live workshop and watch me build it end-to-end.